
Observations
FUNcube telemetry and observations
This next section assumes you have everything connected up and you have successfully launched the FUNcube dashboard software. At this point you can just leave your PC running for several days and see if you capture any activity on the dashboard software...... or you can take a more scientific approach.
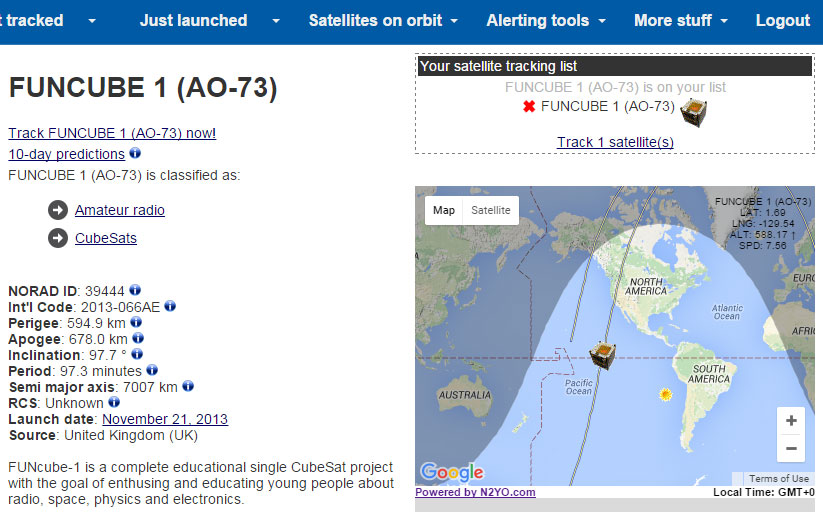
Where is the satellite?
The first thing is to figure out at what time the satellite will be travelling over your location. It is orbiting the Earth at a height of 630 Km and completes an orbit in 97 minutes. From the U.K this means the satellite passes over 3 times in the morning and 3 times in the evening every day. Unfortunately it will not always be directly overhead and if your antenna is eclipsed for example the side of your house, reception will be impaired. I found this out the hard way when I first installed my antenna too close to my house. I moved it down to the end of the garden and get much better reception.
In order to predict when the satellite will pass over your location I recommend using the website http://www.n2yo.com/ Type in the satellite name (in this case AO-73) and a real-time google map picture will appear showing the current satellite position. This website will provide a 10 day prediction of passes over your location and if you register with them, will e-mail you say 10 minutes before a pass is due.
Receiving the FUNcube satellite telemetry
With the FUNcube dashboard running on your laptop you should see a window similar to that shown below;

Make sure the monitor audio tick box is enabled and as the satellite begins it's pass and you start to receive telemetry, you should hear a beep every 5 seconds. This indicates your system is working and receiving a signal from FUNcube.
The telemetry is transmitted in 24 x 5 second frames over a 2 minute period. If the satellite is at a good elevation you should be able to collect in excess of 50 frames during the course of a pass. You should also see the Dashboard software windows in the top panel start to populate with data. These include the status of the Material Science Project, solar panel voltages, EPS power status, power amplifier and so on.
The number of frames captured on each pass will vary depending on several factors including the satellite's elevation as it passes, your geographical position with respect to the satellites footprint and the position / integrity of your antenna and cables. When I first set my system up I received only a few frames during several weeks of passes until I experimented with different antenna positions and waterproofed the RF connectors.
On the right is a short video I made demonstrating the telemetry being received by my laptop during a pass, and the audio you might expect to hear.
Note the beep at 5 second intervals indicating a frame is being transmitted.
Below is an example of satellite telemetry imported to Excel showing the start time and date of the pass - 09/01/2015. A little further along is the data contained in the frame that was received - in this case RT+HR2. Your Excel row will also be populated with the information displayed in the FUNcube dashboard upper panes mentioned on the previous page.
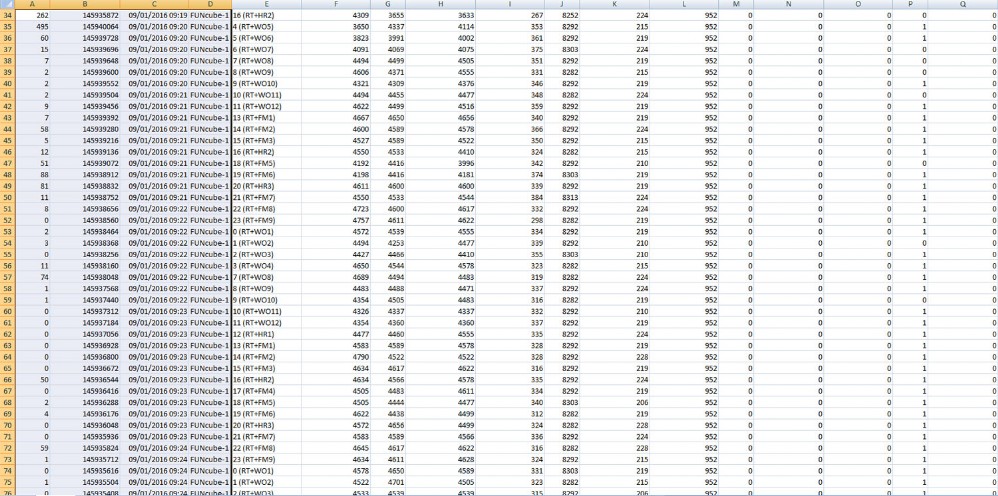
Click here to continue to the third part and a closer look at this telemetry.